By Mika Rantanen
Originally published in Suomen Luonto, October 7, 2026
The year 2026 has been marked by a meteorological anomaly that has not gone unnoticed by weather enthusiasts and climate researchers alike: an extraordinary lack of storm activity across Finland. While the Northern European climate is typically characterized by a succession of Atlantic-driven low-pressure systems, this year has seen a profound shift in atmospheric patterns.
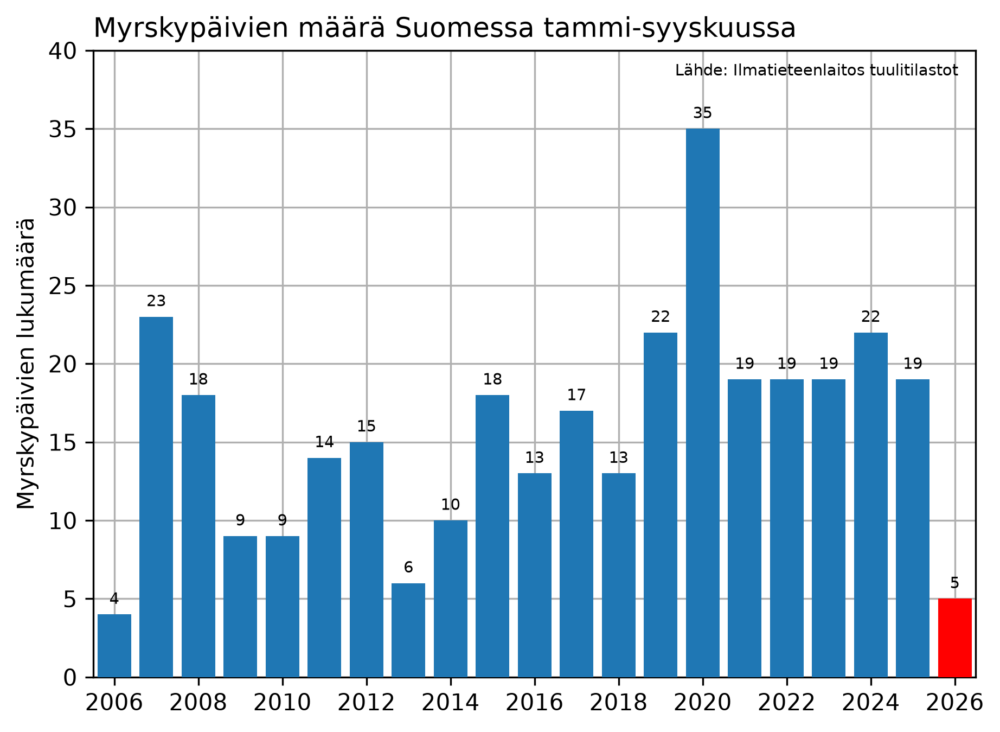
From January through September 2026, the Finnish maritime areas recorded only five days of storm-force winds—defined as a mean wind speed of at least 21 m/s. To put this into perspective, the median for the same nine-month period between 2006 and 2025 is 18 days. This puts the current year in the record books as the second-quietest period in the two decades since comprehensive storm monitoring began in 2006. The only year with less activity was 2006 itself, which saw a mere four storm days during the same interval.
Main Facts: A Statistical Departure from the Norm
The data paints a clear picture of a meteorological "calm." In a typical year, the period between January and September serves as a baseline for measuring the intensity of the winter and spring weather cycles. However, the first two months of 2026, January and February, were defined by an unusually persistent high-pressure system across Northern Europe.
These high-pressure blocks act as a barrier, preventing the formation of deep, moisture-laden low-pressure systems that typically barrel in from the Atlantic. Consequently, while the long-term average for January and February is eight storm days, the early months of 2026 recorded only a single day of storm-force winds.
The implications of this data extend beyond mere curiosity. As we enter the final quarter of the year, meteorologists are watching closely to see if this trend will hold. Historically, the storm season in Finland is heavily back-loaded; approximately 50 percent of the annual storm activity occurs between September and December, a window that represents only 25 percent of the calendar year. Therefore, while the year has been quiet so far, it is statistically possible—though currently not observed—for the total count of storm days to rise rapidly should the weather pattern shift toward a more zonal, windier flow.
Chronology of Calm: A Year-to-Date Overview
The year began with a stifling high-pressure regime that gripped much of the Nordic region. By the end of March, the disparity between historical norms and the 2026 reality was already becoming clear. Throughout the spring and summer, the traditional "storm track" remained largely absent from the Baltic and surrounding maritime zones.
- January–February: The most significant "drought" period, characterized by cold, dry conditions and a lack of pressure gradients necessary to drive high wind speeds.
- March–May: A continuation of stagnant conditions, with localized winds failing to reach the threshold for storm-force classification.
- June–August: Summer months are typically less stormy in Finland, but the overall lack of convective instability meant that even summer squalls were notably absent compared to previous years.
- September: As the autumnal transition began, expectations for increased activity were tempered by the continued presence of stable pressure systems, keeping the total count for the year at five.
Supporting Data: The "Egg or Chicken" Problem
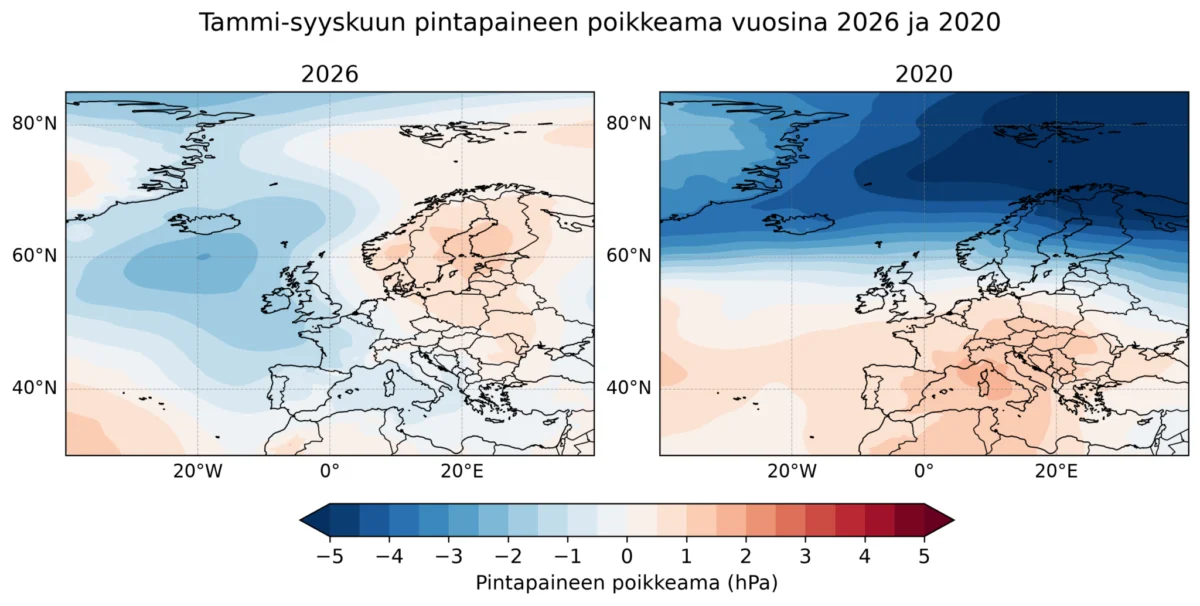
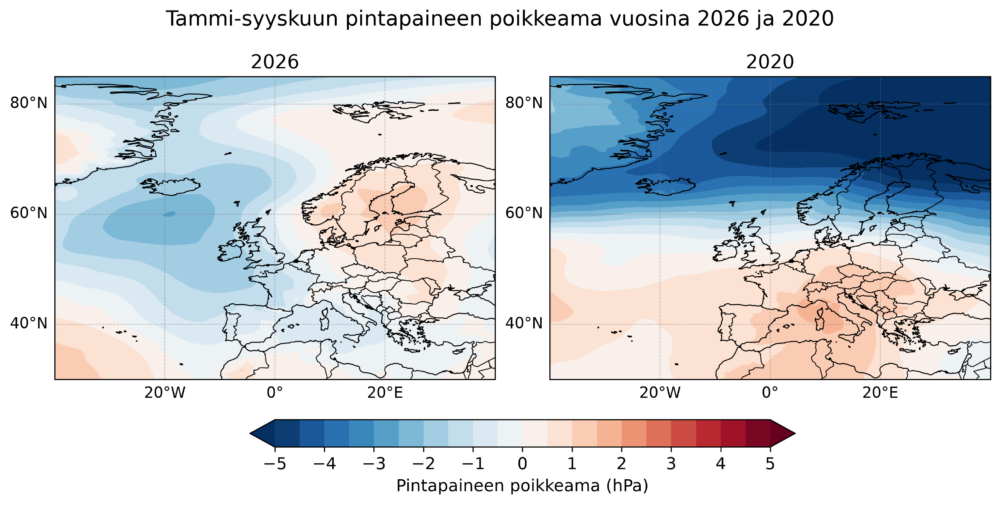
To understand why 2026 has been so quiet, researchers look to the "large-scale weather pattern" (suursäätila). By comparing the air pressure anomalies of 2026 with those of 2020—the stormiest year in the 2006–2026 dataset with 35 recorded storm days—a stark contrast emerges.
In 2020, pressure maps showed a significant negative anomaly over Finland and the regions to its north. This created a strong north-south pressure gradient, which essentially acted as a highway for high-velocity winds. In contrast, 2026 has seen a positive pressure anomaly, where the air pressure has been higher than the long-term average. This high pressure suppresses the development of deep cyclones.
However, a critical nuance exists in this analysis: the "chicken or the egg" causality dilemma. While it is easy to say that the large-scale weather pattern caused the lack of storms, it is equally true that the absence of storms—which are themselves intense physical systems—influences the distribution of air pressure. Therefore, meteorologists warn against viewing these pressure maps as the sole "cause" of the weather. The atmosphere is a coupled system; the storms and the pressure patterns are constantly feeding back into one another, making it difficult to isolate a single driver for the current lull.
Official Perspectives and Long-Term Trends
When looking at the broader picture, the question arises: is this a sign of climate change?
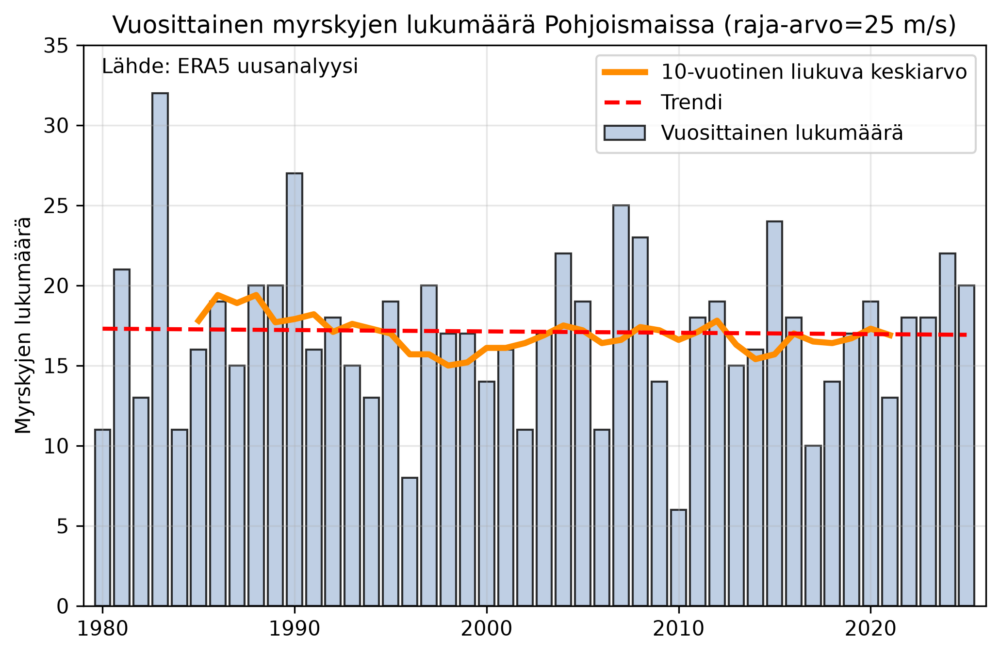
Using the ERA5 reanalysis dataset—a comprehensive climate modeling tool—we can look back to the winter of 1979/1980 to assess long-term storm trends. By analyzing the paths of low-pressure systems and identifying cases where gust speeds over land exceeded 25 m/s (roughly equivalent to a 21 m/s mean wind speed at sea), a clear trend line emerges.
The data suggests that for Northern Europe, there is no statistically significant upward or downward trend in the number of annual storms over the past four decades. The most active year in this dataset was 1983, while the quietest was 2010. The year 2026 is an outlier in the short term, but it does not necessarily signal a permanent change in the regional storm climate.
It is important to note that the definition of a "storm" in these long-term studies is sensitive to the parameters chosen. By adjusting the geographical scope or the gust threshold, one could generate different charts. Our ongoing research, which will be published in a forthcoming scientific paper, aims to provide a more granular look at these changes, utilizing more sophisticated modeling to account for the "negative bias" known to exist in the ERA5 wind speed data.
Implications: The Unpredictability of Autumn
Perhaps the most important takeaway for the public and infrastructure stakeholders is that the quietness of the first nine months of the year is not a predictor for the final three.
Correlation analysis between the storm counts of January–September and October–December reveals a coefficient of R = -0.07—in essence, there is no statistical relationship. History provides plenty of examples of this volatility:
- The 2006 and 2013 Cases: Both years started with very low storm counts but finished with an above-average number of storm days in the final quarter (13 and 18 days, respectively).
- The 2020 Case: This year provided the inverse experience, starting with an incredibly stormy winter and spring, followed by a remarkably calm conclusion.
These examples underscore the inherent chaos of the Northern European climate. While we can identify the current "silent" state of the seas, we cannot definitively say whether the remainder of 2026 will be a tempestuous conclusion or a continued period of calm.
Conclusion: Understanding the Atmospheric Balance
The 2026 storm data serves as a reminder of the natural variability within our climate system. While the public often looks for simple narratives—such as "climate change means more storms"—the reality is far more nuanced. Some regions may experience more frequent extreme events, while others, like Finland this year, may experience extended periods of stability due to shifts in large-scale blocking patterns.
As we look toward the winter months, the meteorological community remains vigilant. The lack of storms thus far is a fascinating case study in atmospheric circulation, but it is not a guarantee of future serenity. The winds of the North are never truly at rest; they are merely waiting for the right pressure configuration to return to their characteristic intensity.
For now, we continue to collect data, analyze the shifting anomalies of the atmosphere, and prepare for whatever the coming winter decides to bring to the Baltic. Our ongoing research efforts are focused on ensuring that we can better distinguish between natural, decadal oscillations and the long-term signals of a changing global climate, providing the public with the most accurate understanding of the forces that shape our weather.